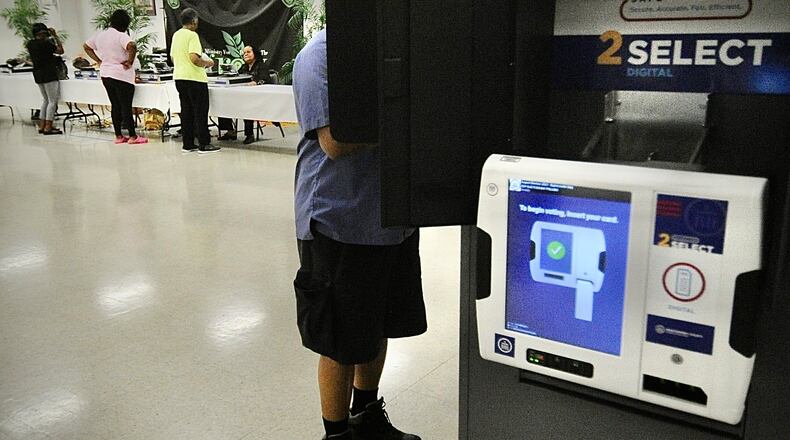
Ohio Issue 1 voting results
| Location | Yes | No | Turnout |
|---|---|---|---|
| Statewide | 43.0% | 57.0% | 38.5% |
| Montgomery County | 39.1% | 60.9% | 37.1% |
| Greene County | 49.5% | 50.5% | 42.8% |
| Clark County* | 50.0% | 50.0% | 37.1% |
| Butler County | 50.3% | 49.7% | 35.3% |
| Warren County | 52.8% | 47.2% | 41.9% |
| Miami County | 61.8% | 38.2% | 41.6% |
| Champaign County | 62.3% | 37.7% | 39.1% |
| Preble County | 67.7% | 32.3% | 38.5% |
| Darke County | 75.1% | 24.9% | 44.3% |
In Other News
1
Recall: Oscar Mayer turkey bacon could be contaminated with Listeria
2
Local 2025 Fourth of July events: Parades, fireworks and festivals
3
Ohio Ice Cream Trail features 150 stops across the state
4
Two local universities announce offices related to DEI will close
5
Hot, sunnier weather expected for Fourth of July weekend
About the Author

